The detectives measure colour with a Vis-NIR System

Chapter 34
? Case overview: Things get pretty colourful in the office of the food detectives. A meat producer would like to control colour of his products to ensure consumer preference and satisfaction. See how the food detectives use quantitative methods measure colour and how NIR compares to commercial colour meters.
The food detectives are sitting down for lunch together when Miss Mapple pulls out her homemade sweet & sour chicken noodle dish. It smells delicious, but the colour is somewhat dull and off-putting. Eggcule Poirot insists one also eats with their eyes, and she should have added some food coloring in there. This launches a long discussion on the importance of colour in food.
After their lunchbreak, Shallot Holmes gathers his team around. He is very happy that he has just the case to match their lunchtime conversation. A client, namely a meat producer, is interested in colour measurement in food. He has no idea what technology can assist him with this, he just knows the colour of his products is important to the final consumer.
Lieutenant Cornlumbo jumps up with excitement. He wants to take the lead in the case, mainly because he knows exactly which instrument can aid this application: the Vis+NIR system! Combining NIR with the Visible range brings the benefit of simultaneously measuring quality parameters and color. And Lieutenant Cornlumbo knows all about colour. After all, deep yellow corn looks more delicious than pale yellow corn! And he’s already held plenty of workshops on NIR such as how to calibrate NIR models and how NIR compares to IR.
The food detectives listen to him carefully as he quickly briefs them on colour of meat products.
For many food products, including meat, the colour at the point of sale depends on many upstream processes in the supply and processing chain. For example, meat colour can be influenced by:
- Animal diet
- Conditions and handling at the time of slaughter
- Specific of other processing steps
To perform quality control on the colour parameter, the food industry typically relies on comparisons with colour charts or standards. But due to the subjective nature of these tests, these methods often lead to inconsistent results.
Lieutenant Cornlumbo suggests using quantitative colour measurements instead, as these methods produce results that are independent of the operator, lighting and the environment. He again suggests using a Vis+NIR spectrometer to achieve this.
Colour measurement differs from “simple” visible spectroscopy by not just taking into account the interaction of light with the sample, but also how light is perceived by the human visual system. The perceived colour is then based on the following factors:
- The sensitivity of the eye to different wavelengths of the light
- The light source illuminating the sample itself
The human visual system uses three different cell types to sense light. Each type is sensitive to different wavelengths, so three metrics are needed to express color as humans perceive it. The sensitivity of the eye is also dependent on the angle under which an object is viewed. There are different standard observers used to describe the sensitivity of different cell types in the eye under these conditions.
The most commonly used options are the CIE 1931 and 1964 observers. From the VIS spectrum and this observer data, X, Y and Z values are calculated to describe perceived color:
- Y: represents luminance (arbitrary assigned value between 0-100 with 100 defined as the brightest colour within the range of the illuminant)
- Z: approximately equals to the blue cone response
- X: mix of the remaining colours
The CIE 1931 XYZ was developed further to include the concept of perceptual uniformity. Perceptual uniformity means that numeric differences in the color should correspond to the same perceived difference at different regions of the colour space.
The XYZ color space is not really perceptually uniform. Instead, the L*a*b color space, which can be calculated from the XYZ color space, can be used to improve this aspect. Here,
- L*: represents the brightness of the sample
- a*: corresponds to red for positive values or green for negative values
- b*: represents yellow for positive values or blue for negative values
As an alternative, the L*a*b colour space can also be transformed into cylindrical coordinates giving rise to the LCh color space. Here,
- L: represents the brightness of the sample
- C: stands for chroma and is a measure of the intensity of the color, especially how different it is from gray
- h: means hue. This is an angle representing the color itself, with hues near 0° being red, those around 90° yellow, 180° green and 270° blue.
This representation has the advantage that similar hues produce similar h values regardless of brightness and chromaticity.
Lieutenant Cornlumbo point out that the NIR system that the detectives use has XZY, L*a*b and LCh color standards available on it.
Lietuentant Cornlumbo moves on to the next set of standards.
Standard Illuminants
Colour measurement also requires illuminant standards, as the type of illuminant strongly affects color perception. Illuminant standards allow comparison of colors recorded under different lighting conditions. Standard illuminants replicate color measurement under a variety of lighting conditions, including different types of daylight illumination, filament bulb and fluorescent lighting. A combination of illuminant type and color space express the color of the object. An colour measurement system could include more than 40 illuminate types together with observer standards. The most commonly used of these are:
- Illuminant A: corresponds to an incandescent light bulb as the light source
- Illuminant D65: represents daylight under specific conditions
Lieutenant Cornlumbo moves on to the next point.
How to set up colour measurement on the Vis+NIR system
Setting up colour measurements involves selecting the observer type and standard illuminant in the application, together with any other compositional constituents that might be needed. During measurement, the detected spectrum is normalized against a white reference standard and the result is converted into tristimulus values. These values undergo further mathematical processing to convert them to the required observer type, or metric, with the selected standard illuminant.
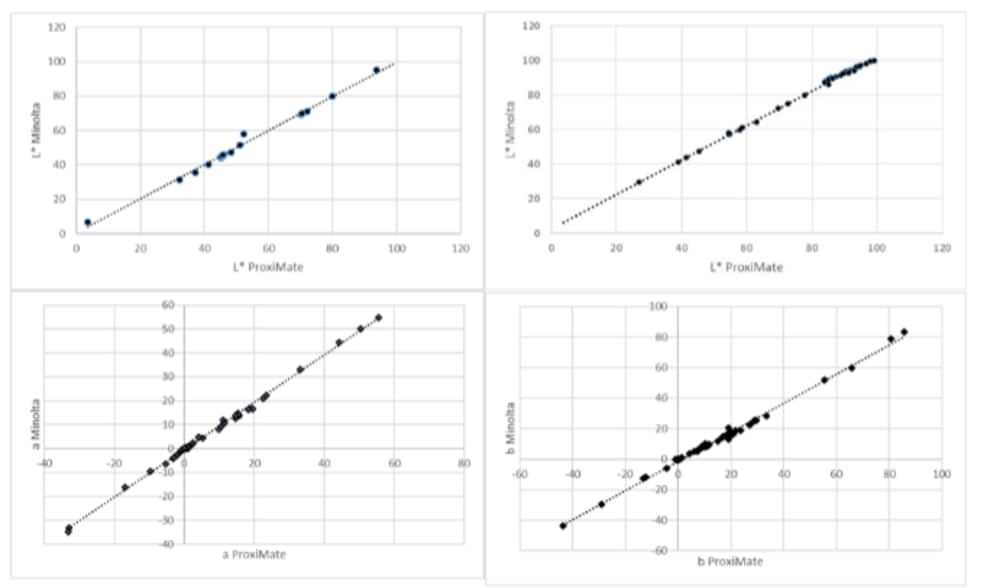
The detectives set out to compare the Vis+NIR colour measurement system with commercially available color meters on a wide range of food samples. They split the brightness parameter (L*) in two categories. The comparison between high gloss samples, which includes meat (top graphs) is different than between matte food samples, such as milk powder and wheat flour (bottom graphs). The figures show there is a close correlation between the NIR system and the color meter for L*, a* and b* parameters.
They head off and present the results to the customer. He is satisfied with what he sees and gives them a colourful welcome and a colourful goodbye! They leave him a nice guidebook on food analytics to give him a better idea on all the parameters he can determine with NIR and make the most out of his production.
Miss Mapple decides this case needs a final touch of colour. She buys some food colouring, bakes up a desert and surprises her colleagues the next day. They are more than happy to eat her delicious AND beautiful rainbow cake.